Sep 11, 2017
How to avoid Google Analytics sampling in Data Studio
7-MINUTE READ | By Paul Koks
[ Updated Jul 31, 2023 ]
In my experience, data sampling is one of the top frustrations many marketers and data analysts have to deal with. Google Analytics is a great tool, but unreliable data is something you want to avoid at all costs.
In this post you will learn about sampling and how it affects your data. Further, I will show how Supermetrics (and the Google Analytics connector) can alleviate your sampling pain while doing session-based analysis in Data Studio. Everything is presented step-by-step so you can easily replicate it for your business. I recommend to read all sections of this article. For your convenience, I have placed direct links to different sections.
Table of contents
- Sampling in Google Analytics
- Native Google Analytics connector
- The effects of sampling
- Case study: e-commerce site
- Supermetrics’ new Data Studio connector
- Concluding thoughts
Sampling in Google Analytics
In data analysis, sampling is the practice of analyzing a subset of all data in order to uncover the meaningful information in the larger data set. Google Analytics might apply session sampling to your data in order to give you accurate reports in a timely way. Especially if you are attracting a large numbers of visitors each month – and are not on GA 360 – you should be careful when analyzing custom, ad-hoc data.
Default reports
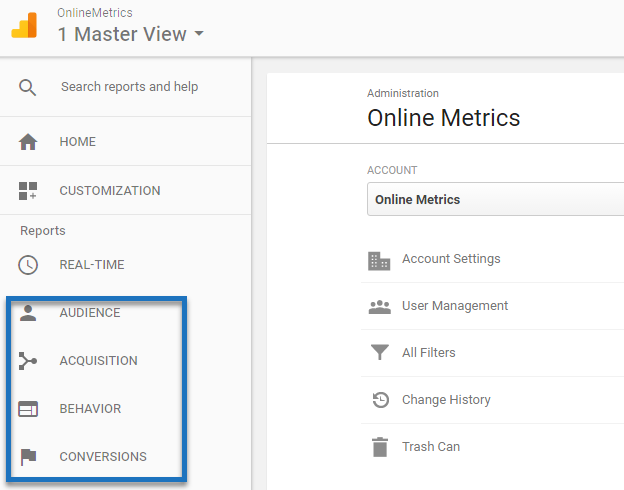
Analytics has a set of preconfigured, default reports listed in the left pane under Audience, Acquisition, Behavior, and Conversions. These reports are not affected by sampling.
Custom reports
Sampling might affect your data once you start modifying your default reports or build custom ones. You should be careful when:
- Applying (custom) segments
- Applying table filters
- Applying secondary dimensions
- Creating custom reports
In the cases above, your data set might be influenced by sampling.
Sampling thresholds
Most people are on the free version of Google Analytics. Here are the sampling thresholds of Analytics Standard and Analytics 360:
- Analytics Standard (Free): 500k sessions at the property level for the date range you are using.
- Analytics 360: 100M sessions at the view level for the date range you are using.
In general, you want to be able to analyze segmented data for at least a four-week period without having to deal with sampling.
Native Google Analytics connector
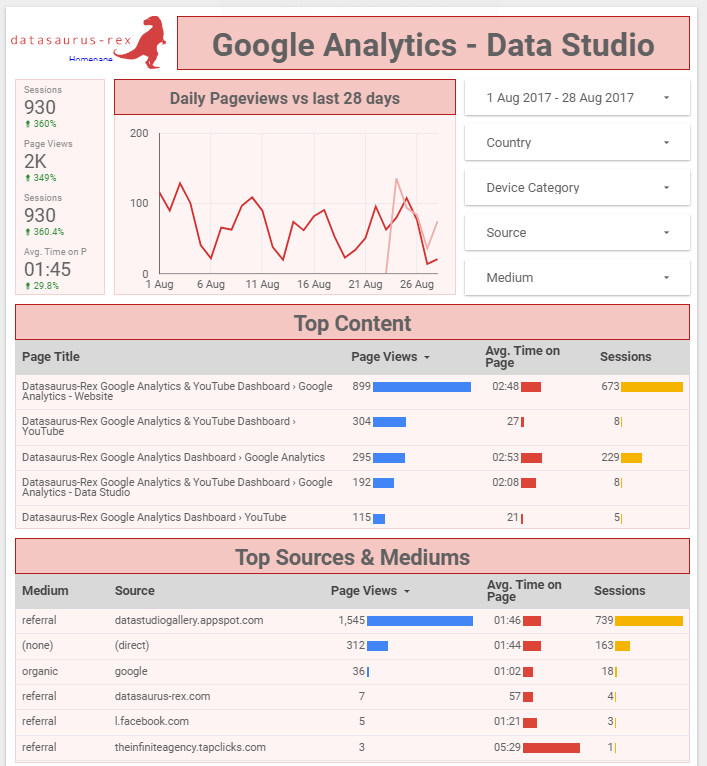
You can build beautiful data visualizations in Data Studio. The native Google Analytics Data Connector works flawlessly if you don’t have to worry about sampling. However, the same challenges with data sampling apply to Data Studio if compared to the Google Analytics reporting environment and API functionality. “The sampling rate for the provided data depends (in part) on the date range: when the range does not include today, the connector returns the highest possible level of precision, with the lowest level of sampling. When the range includes today, the highest level of sampling is applied.” In short, analyzing Google Analytics data in Data Studio doesn’t provide a solution for your sampling challenges.
The effects of sampling
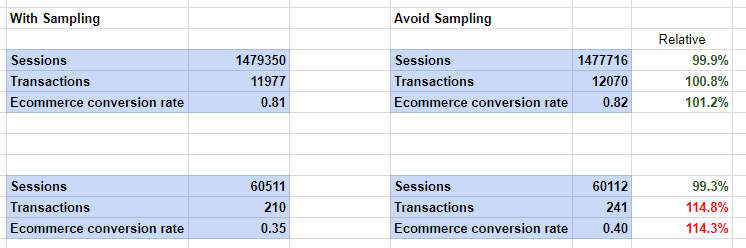
Setting up a few tests on comparing sampled vs. unsampled data is a great way to get a good feeling of how sampling affects your data. You can imagine that a small sample and low values on certain metrics lead to greater inaccuracies in your data. Here is an example of the differences between sampled data and unsampled data (avoid sampling functionality Supermetrics is applied): The data is ad-hoc generated because of the applied custom segments. A few things to note here:
- The Sessions metric isn’t very much influenced in this case (metric in segment has a high value in both cases).
- The Transactions metric seems quite accurate when it is above 10,000. In the second case (more narrow segment) the metric is clearly influenced by sampling.
- The Ecommerce CR metric follows the pattern of the Transactions metric.
- In this case, the sampled numbers are smaller compared to the numbers when using the Supermetrics Avoid Sampling feature.
I recommend using Supermetrics to find out how sampling affects your different data sets. You need to be a Pro user of Supermetrics in order to apply this feature. There are a ton of extra benefits you don’t want to miss!
Case study: e-commerce site
As a digital analytics consultant I have worked for many different clients in all kind of industries. Ecommerce, leadgen, but also services websites might have to deal with sampling. Some companies would suffer from sampling if they select three years of data. Of course it wouldn’t be much of a threat in that case! Others can only accurately analyze data sets of seven days or less. This is a big problem as we want to perform a trend analysis over a longer period of time. Now I will share a short story of how I used Supermetrics to deal with sampling for one of my larger clients. This was configured before the new connector was introduced, which I will explain more about later.
Background
The ecommerce company involved operates internationally and receives millions of visitors each month. It has a very successful online sales platform, but was not yet ready to convert to the GA 360 package. This company was interested in setting up a dashboard in Data Studio that would help them to easily keep track of their ecommerce performance. On the overall level (unsegmented) it wasn’t a challenge to get unsegmented data in Data Studio. Simply connect the native Google Analytics connector to get all metrics and dimensions that you need. In addition, they wanted to get a more segmented view of what was happening in their ecommerce business. This is where we ran into sampling challenges. A few of the interesting segments:
- Visitors that show specific interest in buying a product.
- Visitors that show specific interest in repairing a product.
- Visitors that see the store locator page (sign they are interested in offline buying – extremely low correlation with online purchase).
And we wanted to extract a basic set of metrics per day and on the channel level. As you might have guessed, these in-depth segments and reporting needs led to challenges with data sampling. In their case it made the numbers and insights very much unreliable.
Note: you can set up (site-wide) content groupings in Google Analytics to analyze the value correlation between certain content directories and (ecommerce) performance. For an in-depth value analysis ecommerce value tracking or goal value tracking is required. This is extremely useful when you need to define personas and segments for conversion optimization.
Solution
Together we discussed about different options on how to tackle their sampling challenges. I have leveraged different functionalities of Supermetrics and Google Sheets to solve this challenge.
Step 1: create different data sheets for all segments.
Step 2: schedule an automatic daily refresh. Step 3: connect all individual sheets to Data Studio. Step 4: modify the data sources where needed. E.g. sometimes an imported metric is set as a number instead of the correct Currency. You will want to update anything in the data source that is not in line with how you want to build your report.
Step 5: build the data visualization. Unfortunately I can’t share the Ecommerce Dashboard with you, but I hope by now you understand how the process works!
Supermetrics’ new Data Studio connector
And here comes the exciting part: “Via Supermetrics, it is now possible to build amazing and unsampled data visualizations in Google Data studio by directly connecting Google Analytics to Data Studio.” This means you can surpass Google Sheets and directly pull unsampled Google Analytics data into Data Studio with Supermetrics’ new connector. This saves a lot of time and efforts from your side! And it can solve any sampling issues you might have with the native Google Analytics connector. Let me quickly show you how it works.
Step 1: add Google Analytics connector for Data Studio (click on this link)
Step 2: Click “Authorize” button and follow the instructions in the pop-up window or new page:


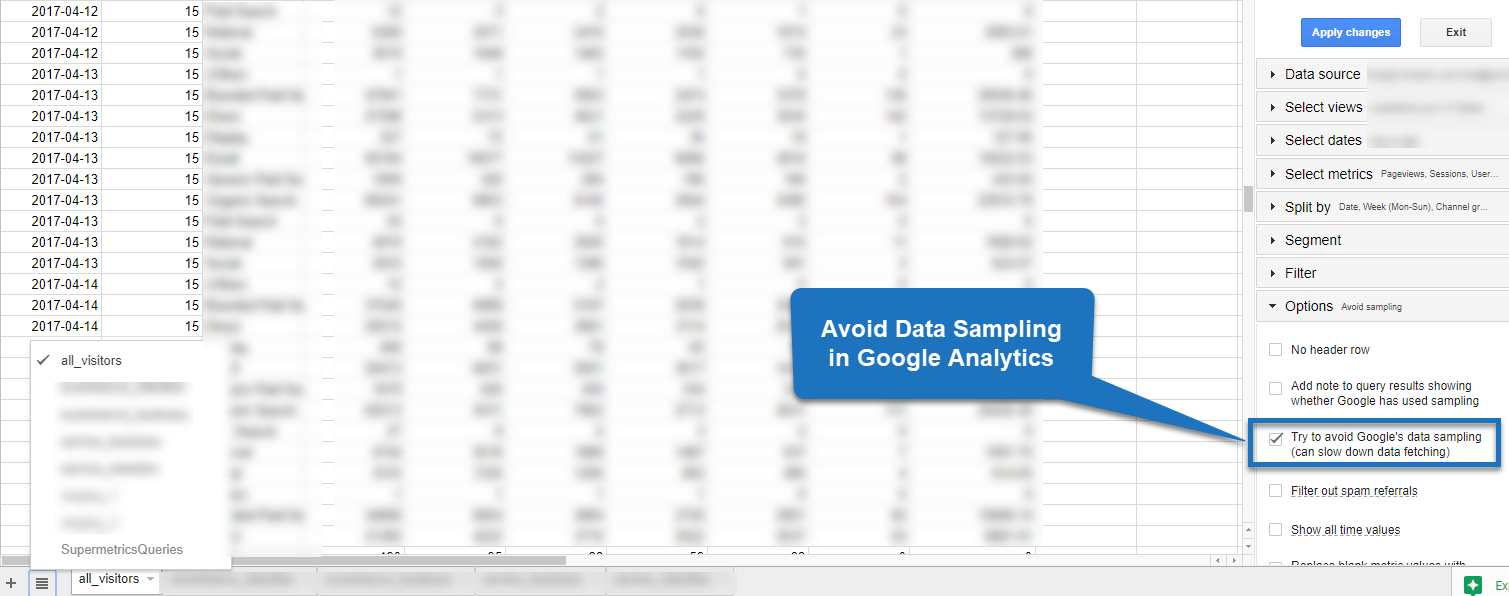
Step 3: select view, segment and avoid sampling.


Step 4: create report with new data source.
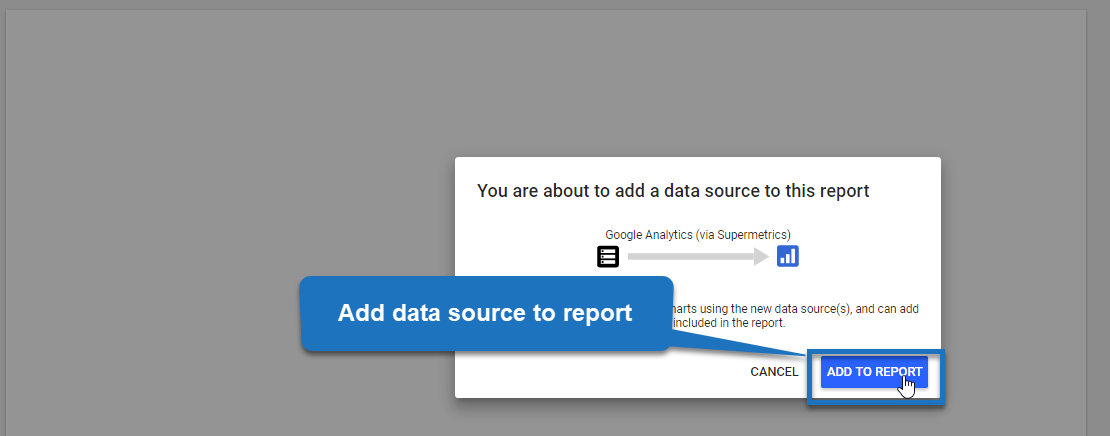
Step 5: add data source to report.
And you are all done! Well, you are halfway actually. Now you can start building your beautiful dashboard in Data Studio with unsampled Google Analytics data. New to Google Data Studio? Make sure to read these tips on effectively building data visualizations in Google Data Studio. You only get better with a tool by actually using it. Data Studio comes with a steep learning curve and you can master it to a certain degree in a short period of time.
Concluding thoughts
- Using Supermetrics’ new connector with Data Studio is a great option for companies that can’t afford or don’t want to invest in GA 360, but still have to deal with large data sets and sampling. Now you can get unsampled data in Google Data Studio without having to store your data in Google Sheets first.
- Note that no third party can guarantee that breaking up larger queries in smaller data queries always works.
- My experience with Supermetrics and the avoid sampling option is that it works flawlessly in most cases.
- Be careful with user-level analysis and sampling effects. Breaking up larger queries might have a significant impact on user-level metrics and the reliability of the data.
- User-level analysis is most reliable on unsampled data without having to break up queries with the user ID feature implemented as well.
- In some cases, you still want to connect Supermetrics to Google Sheets first – instead of directly linking to Data Studio. Google Sheets is a very flexible environment to prepare data sets for complex needs.
This is it from my side. Happy to hear your thoughts on the new Data Studio connector of Supermetrics. And please share it so that everybody knows about and can leverage this great new feature soon!
About Paul Koks

Paul Koks is an Analytics Advocate at Online Metrics and a Supermetrics partner. He is a contributor to industry leading blogs, including Kissmetrics, Semrush, and the author of Google Analytics Health Check. Paul helps companies to capture valuable insights from simple data. You can find him on Twitter or LinkedIn.
Turn your marketing data into opportunity
We streamline your marketing data so you can focus on the insights.